Are you tired of spending your marketing budget on ads that don’t convert? Do you want to target potential customers more efficiently? Propensity marketing could be the answer. By analyzing data to determine which consumers have the highest likelihood of converting, marketers can improve the effectiveness of their campaigns. This article will walk you through what propensity marketing is, how it can be beneficial when leveraged in your targeting strategy, and present a case study with performance metrics so you don’t have to take our word for it.
Propensity Marketing and the Benefits
What exactly is a propensity marketing list? It’s a list of potential customers who have a high propensity or inclination to take a desired action, in this case, purchasing a sightseeing city tour. By targeting individuals on this list, a business can increase the likelihood of conversion and improve the effectiveness of its marketing strategy.
The importance of using a propensity list in paid social campaigns cannot be overstated. By targeting individuals who have previously shown an interest in travel or have booked a tour in the past, a tour operator can increase the likelihood of them booking a tour with their company. This should result in a lower cost-per-click (CPC) and higher conversion rate compared to other awareness and engagement campaign targeting strategies, ultimately leading to more efficient use of ad spend and increased return through the sales funnel.
A Case Study on Propensity Lists in Paid Social Strategy
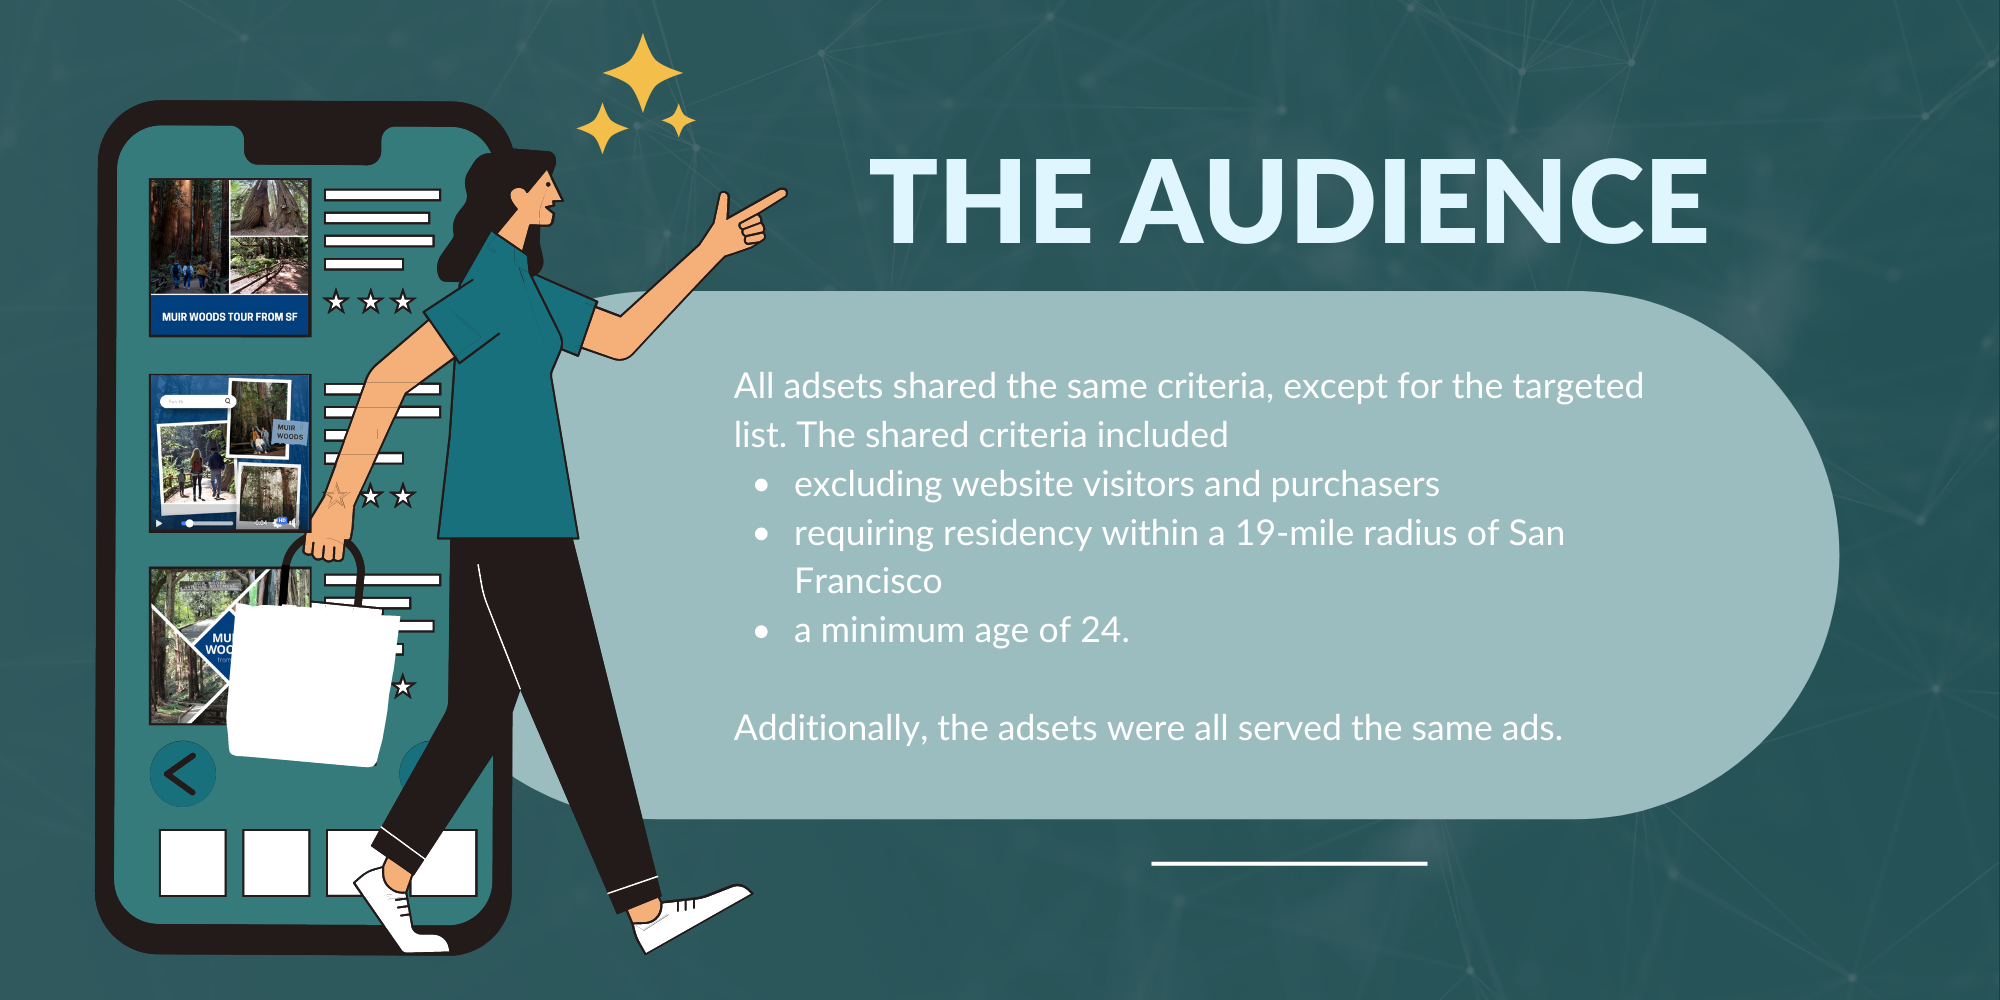
City sightseeing tour operator, Gray Line San Francisco, put a propensity list strategy to the test on Facebook and Instagram. In testing the effectiveness of the audience, they will first target an All Purchasers Audience and a Lookalike of Historical Travelers Audience. By targeting individuals who have a history of purchasing tours, Gray Line San Francisco can effectively reach a group with a higher propensity to book again. This campaign is particularly valuable given the competitive nature of the San Francisco market.
Say goodbye to wasted ad spend and hello to a more efficient and effective marketing strategy with propensity marketing and Gray Line San Francisco’s innovative paid social campaign.
Measuring Propensity Campaign Performance
Campaign performance is crucial for any business looking to achieve its marketing objectives. One effective way to measure the success of a campaign is by conducting A/B tests, which allow you to compare different versions of a campaign to determine which one performs better. For this strategy, we deployed three A/B tests to measure the true comparative performance.
A/B Test 1: Optimizing the Original Campaign Audiences
The first test compared the performance of two campaigns with two different audiences:
- All Purchaser Campaign with the Historical Travelers Propensity Audience
- All Purchaser Lookalike Campaign with a 1% Lookalike of Historical Travelers Propensity Audience
The results showed that the Lookalike campaign slightly outperformed the All Purchaser campaign in terms of Click-Through Rate (CTR) and cost-effectiveness. The CTR for the Lookalike campaign had a 73% increase compared to the All Purchasers campaign. Additionally, the cost per click for the Lookalike campaign was 43% lower compared to the All Purchasers campaign.
A/B Test 2: Introducing A Propensity List
A/B Test 2 compared the performance of the winning campaign from the A/B Test 1 and the next test campaign and audience:
- All Purchaser Lookalike Campaign with the Lookalike of Historical Travelers Propensity Audience
- All Vertical Lookalike 8% Campaign with a Vertical Specific 8% Lookalike of Historical Travelers Propensity Audience
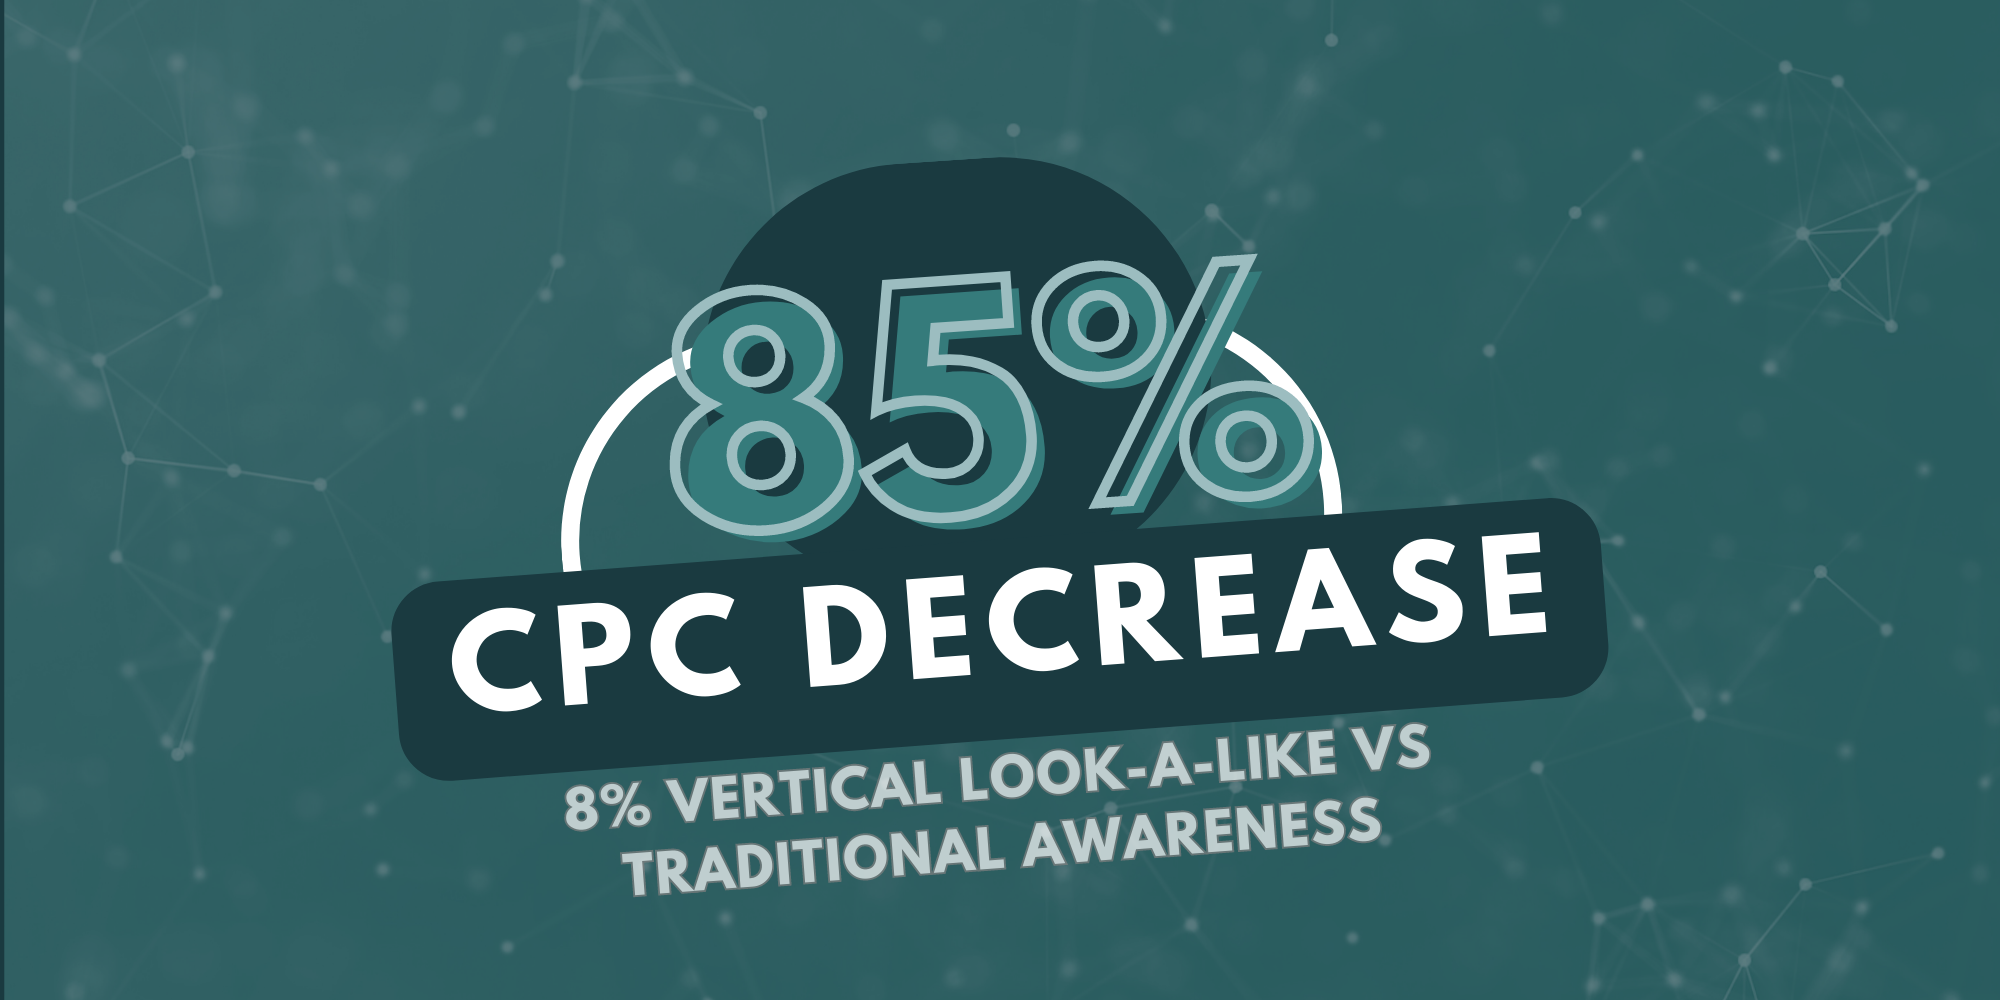
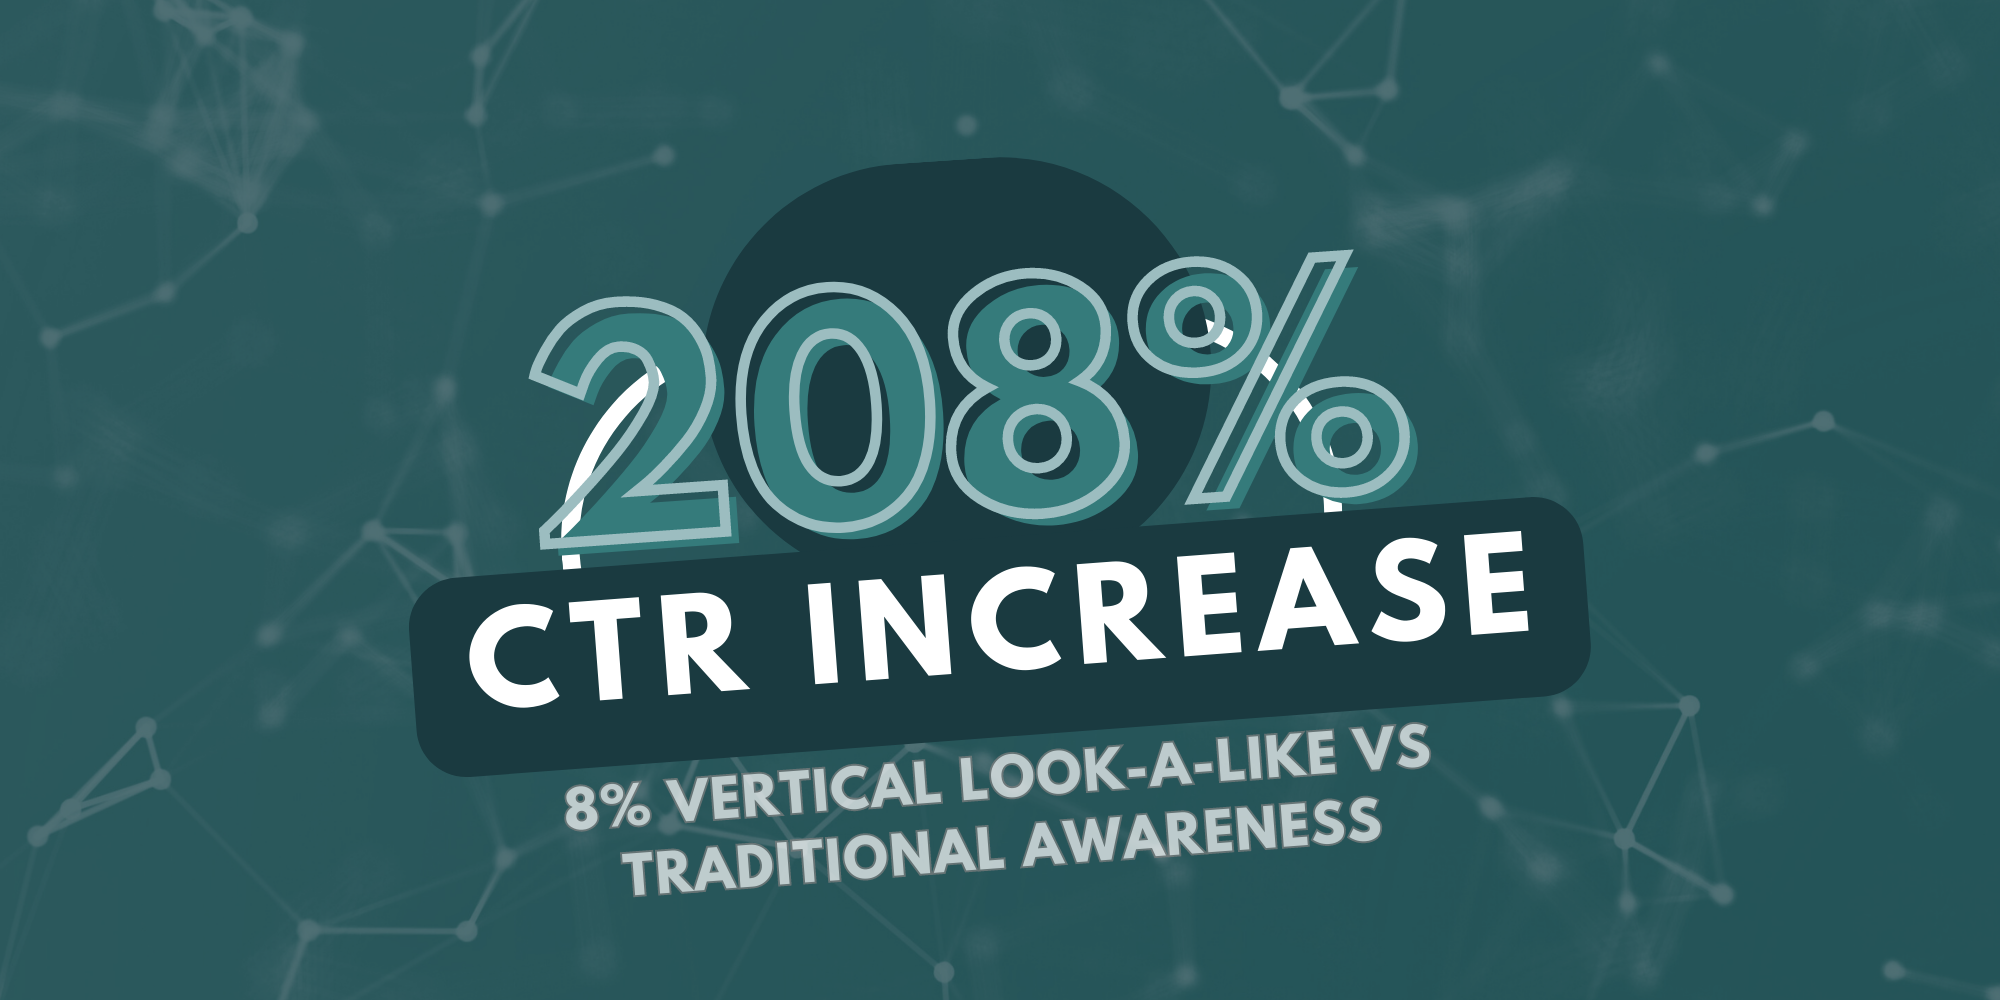
The results showed that the All Vertical Lookalike 8% campaign outperformed the All Purchaser Lookalike campaign in terms of reach, CTR, and cost-effectiveness. The CTR for the All Vertical Lookalike 8% campaign was 460% higher compared to the All Purchaser Lookalike campaign. Additionally, the cost per click and cost per landing page were 70% lower for the All Vertical Lookalike 8% campaign.
A/B Test 3: Testing the Best Propensity List
A/B Test 3 compared the performance of the winning campaign from A/B Test 2 and the next test campaign and audience:
- Vertical Purchaser Lookalike 1% Campaign with a Vertical Specific 1% Lookalike of Historical Travelers Propensity Audience
- All Vertical Lookalike 8% Campaign with a Vertical Specific 8% Lookalike of Historical Travelers Propensity Audience
The results showed that the Vertical Purchaser Lookalike 8% campaign outperformed the Vertical Purchaser Lookalike 1% campaign in terms of reach, CTR, number of clicks, cost per click, and cost per landing page. The CTR for the 8% Lookalike campaign was 53% higher compared to the 1% Lookalike campaign. Additionally, the 8% Lookalike campaign generated more clicks at a 59% lower cost than the standard All Vertical campaign.
Overall, the operator’s propensity marketing campaign has proven to be a successful and cost-efficient way to reach potential customers in a competitive market. By utilizing propensity lists and conducting A/B tests to measure performance, businesses can achieve their marketing objectives and improve their ROI. So, say goodbye to wasted ad spend and hello to a more efficient and effective marketing strategy with propensity marketing